

Product Center

蒙自Underground Pipeline Drainage Monitoring System
Product Description
I. Customer Pain Points
1. Frequent urban flooding causes significant losses:
During heavy rainfall, it's impossible to monitor in real time the water levels and flow rates at critical network nodes (such as flood-prone areas and forebays of pumping stations), making timely warnings and dispatching difficult.
The cause of the accumulated water remains unknown, leading to a delayed response that has resulted in traffic paralysis, property damage, and even poses a threat to life safety.
Post-disaster reviews lack precise data support, making effective improvement difficult.
2. Sewage overflow puts environmental pressure on:
Combined sewer systems are prone to combined sewer overflows (CSOs) during rainy weather, contaminating river water bodies and facing increasingly stringent environmental regulations as well as growing public pressure.
It is difficult to accurately identify the time, location, and magnitude of overflow events, making source tracing challenging and hindering the development of targeted solutions for remediation.
3. Pipeline network hazards, inefficient operations and maintenance:
Pipeline systems suffer from issues such as aging, sediment buildup, damage, and leakage—problems that are often hidden and difficult to detect. Traditional manual inspections are inefficient, offer limited coverage, and carry high risks.
Without real-time data, it’s impossible to proactively predict and pinpoint congestion points and structural defects, leading to "reactive emergency responses." This not only results in high repair costs but also increases the risk of secondary disasters, such as road surface collapses.
The allocation of operations and maintenance resources (human labor, vehicles) lacks data-driven decision-making, leading to inefficiencies and waste.
4. Information silos, making decision-making difficult:
The basic information of the pipeline network (drawings, pipe diameter, material, burial depth) is incomplete or outdated.
Operational data (water level, flow rate, water quality) is either missing or scattered across different departments/systems, making it difficult to create a unified overview.
Without intelligent analysis tools, decision-making relies on experience, resulting in insufficient scientific rigor and making it difficult to support pipeline network planning, renovation, and emergency command.
5. Slow Emergency Response:
Facing sudden pollution incidents or pipeline accidents, there is a lack of capability for rapid localization and impact assessment.
Emergency dispatch instructions are inefficient to transmit, and feedback on on-site situations is slow.
II. Overview of the Plan
1. Stereoscopic Perception Network:
Intelligent sensing terminal:
Level gauge: Deploy at critical locations such as inspection wells, pump stations, regulating and storage ponds, and flood-prone areas to monitor water levels in real time.
Flow meter: (Doppler, area-type, and others) installed on main pipes, critical branch lines, and overflow outlets to precisely measure flow velocity and flow rate.
Water quality sensor: (pH, conductivity, COD, ammonia nitrogen, turbidity, etc.) are deployed at river inlets, wastewater treatment plant influents, and key discharge points to monitor water quality changes, identify pollution sources, and detect overflows.
Manhole Condition Monitor: Monitor manhole cover displacement and abnormal movements to prevent theft and ensure pedestrian safety.
Pipeline Robot/CCTV: Used for periodic internal inspections to assess structural conditions.
Rain gauge: Deployed regionally to provide rainfall input data.
High-Reliability Communication:
By leveraging NB-IoT/LoRa (Low-Power Wide-Area Networks) and 4G/5G networks, we ensure stable, low-power data transmission even in complex underground environments.
Edge Computing:
Deploy edge gateways at critical nodes to enable local data preprocessing, caching, and initial anomaly detection, thereby reducing cloud-side workload and enhancing response speed.
2. Underground Pipeline Network Drainage Monitoring Platform:
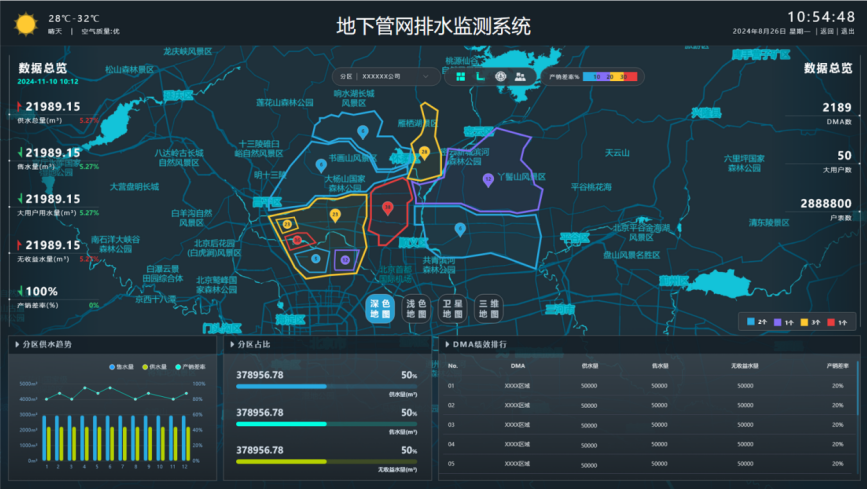
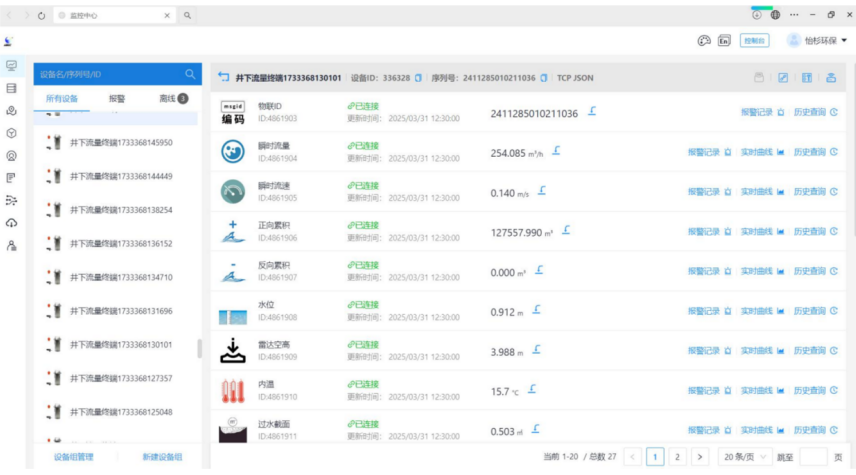
Data Integration Center :
Unifiedly access and manage multi-source heterogeneous data from sensors, SCADA systems, GIS geographic information systems, meteorological sources, video surveillance, and more.
Real-time Monitoring and Visualization:
Based on GIS maps, dynamically display information such as network-wide water levels, flow rates, water quality, and equipment status, enabling "single-map" management. It also provides tiered alerts—ranging from normal to attention, warning, and severe.
Intelligent Analysis and Early Warning:
Urban Flooding Prediction Model: By integrating real-time monitoring data, rainfall forecasts, network models, and terrain information, we can predict the depth, extent, and duration of waterlogging at vulnerable areas over the coming period, enabling timely issuance of warnings.
Overflow Warning Model: Real-time computing analyzes pipeline fullness and flow trends, predicting overflow risk points and timing.
Clog Warning Model: By analyzing flow velocity and water level variation patterns, combined with historical data, identify potential sedimentation locations.
Water Quality Anomaly Analysis: Real-time comparison of water quality parameters, enabling rapid identification of pollution events and source tracing.
Intelligent Scheduling and Decision Support:
Based on forecasts and real-time conditions, provide optimized recommendations or automated control instructions for pump station operation, gate regulation, and drainage resource allocation.
Simulate the effects of different rainfall scenarios and dispatch plans to support the development of emergency response strategies.
Operations and Maintenance Ticket Management:
Based on early warnings, inspection plans, or reported incidents, it automatically generates, dispatches, and tracks maintenance work orders, enabling closed-loop management. It also supports field operations via a mobile app.
Comprehensive Reports and Analysis:
Generate operational reports, performance evaluations, sedimentation analyses, overflow statistics, and more, providing data support for management decisions and planning.
Standardization and Security Assurance:
Follow relevant industry standards and specifications.
Establish a comprehensive security system featuring robust data backups, user access management, network firewalls, and more, to ensure data security and system stability. 。
Joint Analysis Based on Flow Rate and Liquid Level
① Abnormal upstream and downstream traffic matching
Scene: The upstream pipeline flow continues to exceed the downstream flow during the same time period, and the liquid level shows no significant drop.
Conclusion: There may be pipeline leaks (such as damaged connections or corrosion-induced perforations) or illegal diversion and discharge (such as unauthorized branch pipe connections).
Extended applications: By integrating GIS pipeline maps, pinpoint the interval of leakage points to reduce manual inspection costs.
② Sudden Rise in Liquid Level and Abrupt Flow Variation
Scene: In a short period of time, the liquid level in a certain area rises rapidly (e.g., exceeding the warning threshold), yet the upstream flow does not increase accordingly.
Conclusion:
Pipe blockages (such as sediment or foreign objects accumulating) lead to poor water flow;
Rainwater backflow occurred during the heavy rainfall (to be verified in conjunction with meteorological data);
Pump station failure (e.g., pump shutdown, leading to reduced downstream pumping capacity).
Action recommendation: Initiate the emergency response, prioritizing the inspection of potential blockage points (such as bends and reducer sections) or activating the backup pump station.
③ Level-Flow Deviation in Bypass-Free Piping Networks
Scene: In the straight, unbranched pipe section, the upstream liquid level rises, but the downstream flow does not increase proportionally.
Conclusion:
Localized pipe narrowing (such as scaling or biofilm thickening) leads to a decrease in flow capacity;
External water infiltration (e.g., groundwater seeping in through damaged pipe walls, which requires verification using conductivity testing).
Key applications of the conductivity parameter
Identification of External Water Intrusion
Scene:
The electrical conductivity in the sewage network suddenly drops (falling below normal sewage levels), while the liquid level rises simultaneously.
Electrical conductivity in the stormwater drainage network has abnormally increased (approaching levels typically found in domestic sewage or industrial wastewater).
Conclusion:
There may be groundwater infiltration into the sewage network (groundwater typically has lower electrical conductivity than sewage).
Rainwater drainage systems may become contaminated due to sewage backflow (e.g., from damaged sewer pipes or improper connections to rainwater pipes) or illegal discharge of industrial wastewater.
Extended value: By analyzing the spatiotemporal distribution of conductivity, trace the location of mixing points (e.g., if upstream conductivity is normal but downstream it suddenly changes, the mixing point lies between the upstream and downstream monitoring stations).
Multi-parameter Coupling Analysis and System Health Assessment
①. Pipeline Network Operation Efficiency Assessment
Metrics:
Fullness Level (Level / Pipe Diameter): If the level consistently exceeds 80%, it indicates that the network load is nearing its upper limit, requiring either expansion or dredging.
Flow Rate - Liquid Level Slope: Under normal operating conditions, the flow rate increases linearly as the liquid level rises. However, if the slope becomes flatter, it indicates a decline in the pipeline's flow capacity (e.g., due to scaling or sediment buildup).
Conclusion: Quantitatively assess the aging level of the pipeline network, and prioritize maintenance for inefficient pipe sections.
②. Verification of Stormwater and Sewage Separation Effectiveness
Scene:
During the rainy season, the conductivity of the stormwater drainage network remains at a low level (<500 μS/cm), and the flow rate is positively correlated with rainfall.
The sewage network maintains stable flow rates during non-rainfall periods, with no abnormal fluctuations in conductivity.
Conclusion: The stormwater and sewage separation system is operating normally; however, if the conductivity of the stormwater network increases during the non-rainy season, it may indicate improper connections of sewage pipes.
III. Benefit Analysis
1. Enhance Flood Prevention and Drainage Capabilities:
Reducing Urban Flooding Losses: Precise early warning and dispatch systems can effectively shorten waterlogging durations, minimize the extent and depth of flooding, and significantly cut down on direct economic losses such as traffic disruptions, vehicle submersion, and shop inundation.
Improve response efficiency: Shift from passive emergency rescue to proactive prevention, gaining valuable time for crisis management.
Optimizing drainage resources: Providing precise guidance on the deployment of emergency response teams and equipment to avoid resource wastage.
2. Effectively control sewage overflows and improve the water environment:
Reduce overflow volume: Accurately predict and schedule flows, maximizing the utilization of pipeline networks and storage facilities to significantly minimize river overflows.
Reduce environmental risks: Meet environmental regulatory requirements, avoid hefty fines, and enhance the reputation of your company or city.
Supporting water environment management: Providing precise overflow data to offer a scientific basis for stormwater-sewage separation upgrades and CSO control projects.
3. Optimize pipeline network operations and maintenance to reduce costs and improve efficiency:
Reduce operational and maintenance costs: Shift from "planned maintenance" to "on-demand maintenance," minimizing unnecessary inspections and blind dredging efforts. Precisely identify fault locations, cutting down repair time while lowering labor and vehicle-related expenses.
Extending the lifespan of the pipeline network: Timely detection and addressing issues such as clogging, leakage, and corrosion can slow down aging, reducing costs associated with major repairs and replacements.
Enhancing Operations and Maintenance Efficiency: The work order system enables streamlined management, while the mobile app boosts efficiency for on-site operations.
4. Enhance Emergency Response and Decision-Making Capabilities:
Rapid localization and response: Quickly locate incidents such as pipe bursts and pollution events, and assess the extent of their impact.
Scientific Decision Support: Leveraging real-time data and model simulations to provide scientific backing for emergency command, thereby enhancing decision-making efficiency and accuracy.
5. Accumulate data assets to empower long-term growth:
Digital twin of the pipeline network: The accumulated operational data serves as the foundation for building and calibrating the network's hydraulic model, creating valuable digital assets.
Supporting scientific planning: Providing precise data for the construction, renovation, and expansion of pipeline networks, thereby avoiding investment waste.
Enhancing Management Transparency: Achieving visibility, awareness, and control over the operational status of the drainage system, thereby elevating the modernization of management practices.
6. Enhance societal satisfaction:
Ensure the safety of citizens' travel and the normal order of daily life.
Improve the urban water environment, enhancing residents' quality of life and the city's image.
Enhance the city's ability to respond to extreme weather and emergencies.

Jiangsu Degao Internet of Things Technology Co., Ltd.
Consulting
+86 15996603530
degao@163.com
Address
No. 158, Xinsheng Road, Nantong, Jiangsu, Maipu Technology Park
Subscription Number
Service Number
Mobile phone QR code
Copyright © 2025 Jiangsu Degao Internet of Things Technology Co., Ltd.
Website Construction:Zhongqi PowerNantong|Tag|City Substation